Predict response distributions, parameters, additive predictors, terms, or response means from a gamlss2 model.
Usage
## S3 method for class 'gamlss2'
predict(object, parameter = NULL, newdata = NULL,
  type = c("distribution", "parameter", "link", "response", "terms"),
  terms = NULL, se.fit = FALSE, drop = TRUE, ...,
  level = NULL, interval = c("none", "wald"), unconditional = FALSE)
Arguments
object
A gamlss2 model.
parameter
Distribution parameter name(s) or index(es), such as “mu” or “sigma”; defaults to all parameters.
newdata
Data frame for predictions; defaults to the fitted data.
type
“distribution” (default) returns distributions3 objects; “parameter” returns parameters on their natural scale; “link” returns additive predictors; “response” returns response means; “terms” returns individual additive terms. Specifying parameter without type selects “parameter”.
terms
Additive terms to include; defaults to all. Names are partially matched unless nogrep = TRUE is passed in ….
se.fit
For ordinary predictions, TRUE computes standard errors from coefficient draws; R in … sets the number of draws (default 200).
drop
Simplify the result when possible.
level
Numeric confidence level(s) between zero and one; supplying levels selects pointwise Wald intervals.
interval
“none” (default) returns ordinary predictions; “wald” returns analytic pointwise confidence intervals, at the 95% confidence level by default.
unconditional
If TRUE, include approximate smoothing-parameter uncertainty in Wald intervals and coefficient draws. This requires a likelihood fit without stored posterior samples.
…
Further controls, including FUN (a function summarizing predictions across coefficient draws), R (number of Gaussian draws, default 200), seed (default 123; FALSE continues the current random-number stream), and burnin for simulation. For likelihood fits, FUN or se.fit = TRUE requests simulation; R alone does not.
Details
Coefficient draws stored in the fit are used when available; R does not replace stored posterior samples. Otherwise, Gaussian draws use the full joint coefficient covariance, retaining dependence among terms and distributional parameters. For penalized likelihood fits, this approximation is motivated by the Bayesian interpretation of smoothing penalties. Nonlinear transformations can produce asymmetric uncertainty distributions.
To propagate uncertainty to a quantile or event probability, retain the joint distribution draws with FUN = identity, evaluate the quantity within each draw, and then summarize across draws at each prediction location. These intervals describe estimation uncertainty in the chosen quantity. Quantiles of the fitted response distribution instead give plug-in prediction intervals for a future observation.
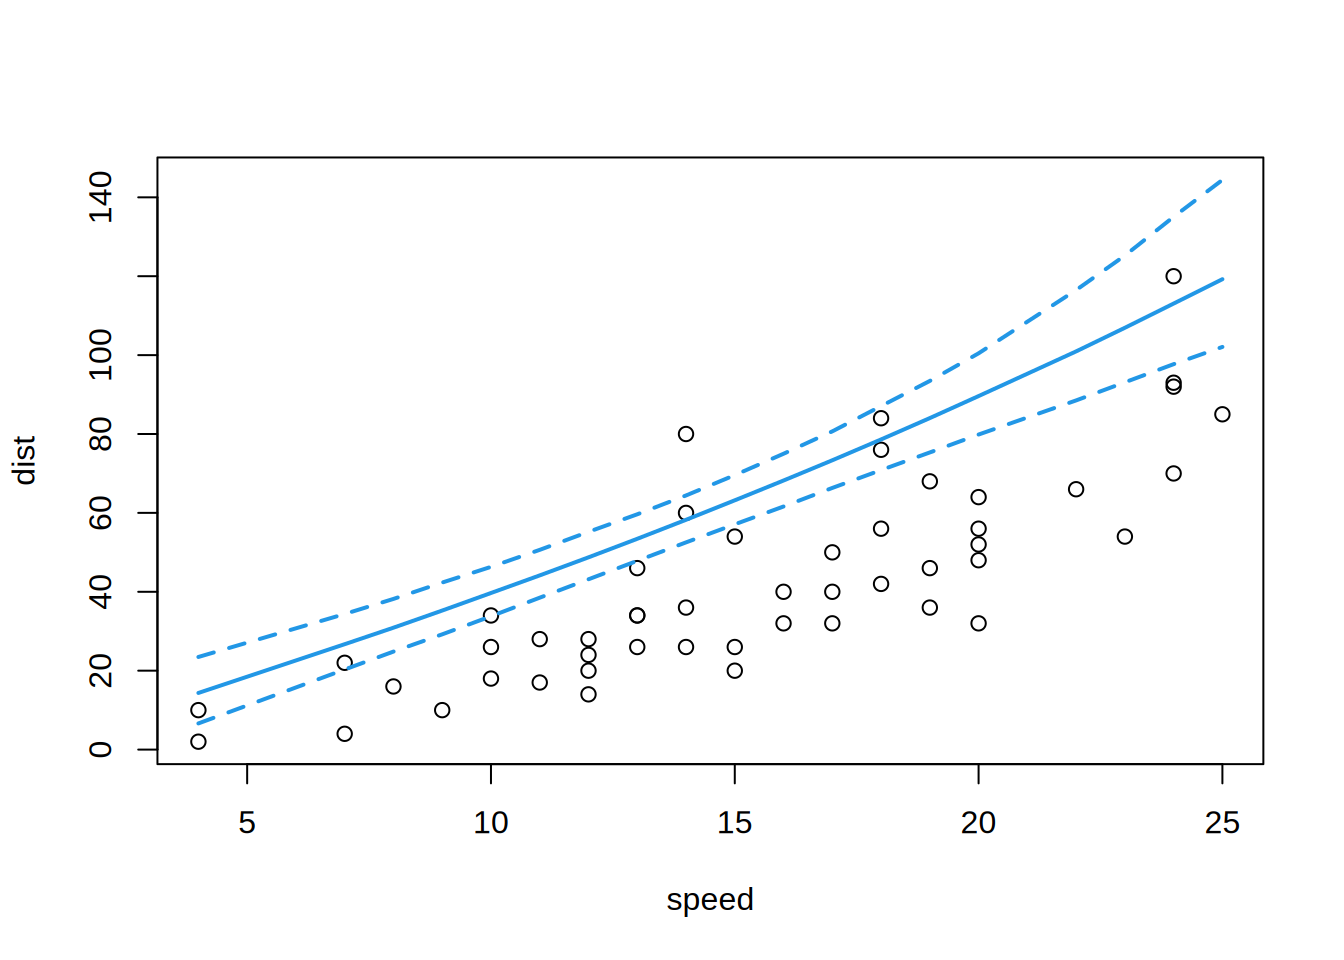
Wald intervals are approximate pointwise confidence intervals for fitted values, not prediction intervals for future observations. They are computed without simulation and may be asymmetric on transformed scales. They condition on fitted smoothing parameters by default and exclude model-selection uncertainty; see vcov.gamlss2.
Wald intervals support maximum-likelihood fits with linear terms and coefficient-linear mgcv smooths, but not nonlinear custom special terms. They cannot be combined with FUN, R, seed, or burnin. An indefinite joint information matrix or non-estimable coefficient causes an error rather than a working-information approximation.
Value
Ordinary predictions return a distribution object or values in the selected form. Term predictions are data frames or, for multiple parameters, lists of matrices. With se.fit = TRUE, simulation summaries use names fit (simulation mean) and se (simulation standard deviation), prefixed by parameter or term names when needed. A supplied FUN determines the simulation summary; its center can differ from the prediction at the estimated coefficients. With FUN = identity, simulated distribution predictions form a list of distribution objects, one per joint coefficient draw.
Wald predictions return fit, se.fit, lower, and upper. For multiple levels, lower and upper are lists named by confidence percentage (for example, “80%” and “95%”). fit and each bound retain the structure selected by parameter, terms, and drop; se.fit is shared across levels.
library("gamlss2")## fit heteroscedastic normal GAMLSS model## stopping distance (ft) explained by speed (mph)data("cars", package ="datasets")m <-gamlss2(dist ~s(speed) |s(speed), data = cars, family = Normal)
GAMLSS-RS iteration  1: Global Deviance = 405.0351 eps = 0.130476
GAMLSS-RS iteration  2: Global Deviance = 405.6171 eps = 0.001437
GAMLSS-RS iteration  3: Global Deviance = 405.6598 eps = 0.000105
GAMLSS-RS iteration  4: Global Deviance = 405.6622 eps = 0.000005
## new data for predictionsnd <-data.frame(speed =c(10, 20, 30))## default: a "distribution" objectd <-predict(m, newdata = nd)print(d)